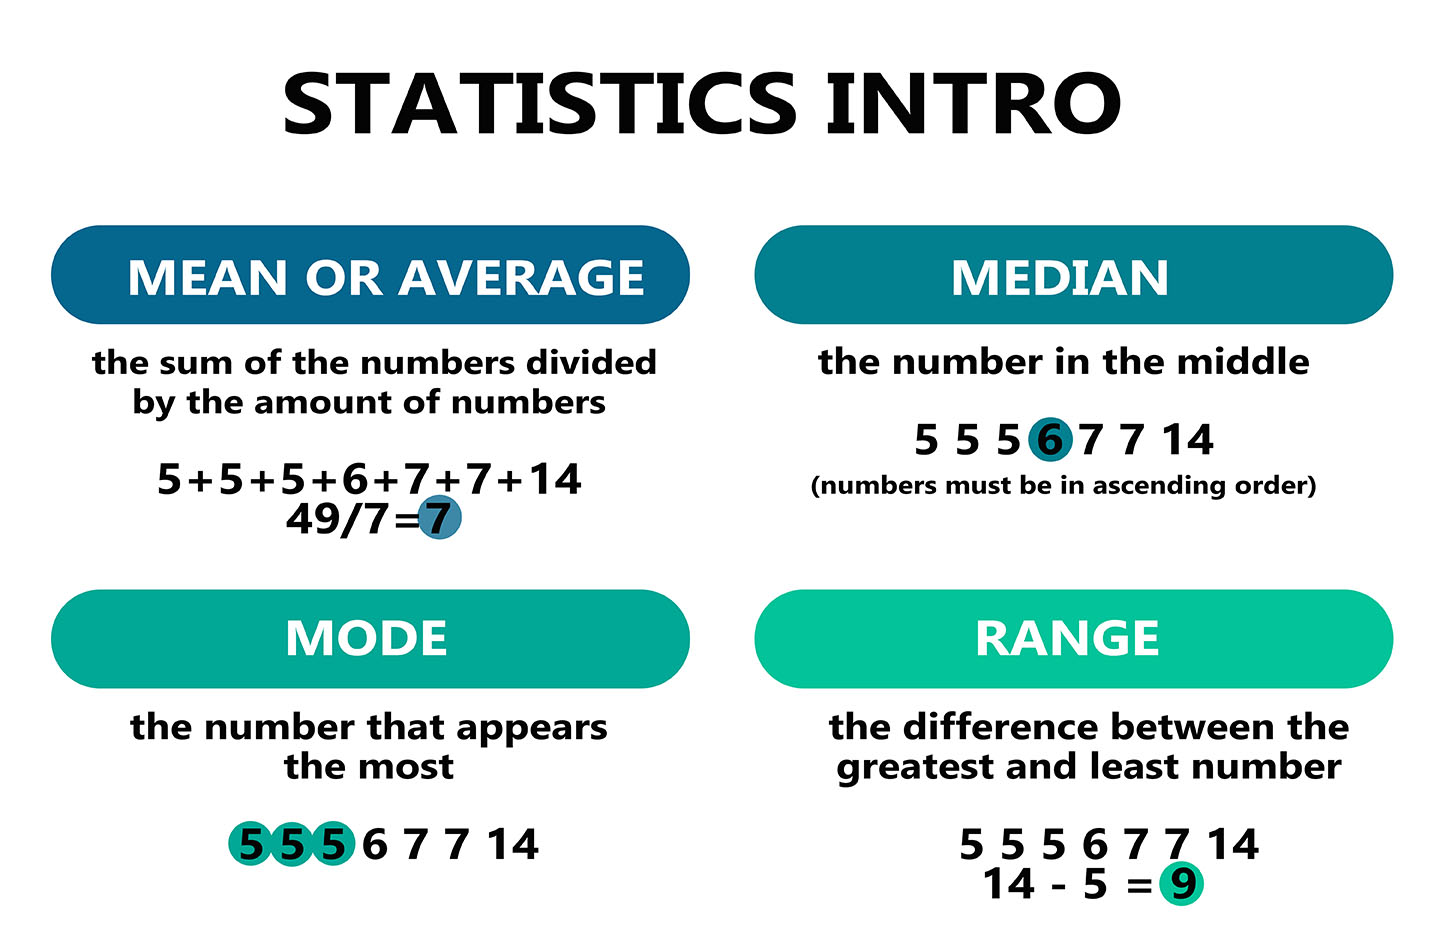

In statistics, the median is the middle value in a sorted distribution. This means that half of the values in the distribution are larger than the median and half are smaller.
The median is a measure of central tendency, which means that it represents a typical value in the distribution. It is not as sensitive to outliers as the mean, which is the average of all the values in the distribution.
The median can be calculated for any set of data, regardless of whether the data is numerical or categorical. For example, the median of the set {red, blue, green, yellow} is blue.
The median is a useful measure of central tendency for a variety of reasons. It is relatively easy to calculate, it is not affected by outliers, and it can be used for any type of data.
The median score on the test was 75.

Noun:
Adjective:
Verb:
The word "median" comes from the Latin word "mediānus," which means "of the middle." The Latin word "mediānus" is derived from the Proto-Indo-European root *medhyo-, which also means "middle.".
The word "median" first appeared in English in the 16th century. It was originally used in the sense of "the middle point of a line." The word "median" was later used to refer to the middle number in a sorted distribution.
What is a median?
Question:
Define the concept of a median in statistics and explain how it differs from the mean. Provide an example of calculating the median from a data set and discuss its significance in representing central tendency.
Answer:
In statistics, the median is a measure of central tendency that represents the middle value in a dataset when the values are arranged in order. Unlike the mean, which is the arithmetic average of all values, the median is not affected by extreme values or outliers in the data.
For instance, consider a dataset of exam scores: 75, 80, 85, 90, and 95. To find the median, you arrange the values in order: 75, 80, 85, 90, 95. Since there are five values, the middle one is the third value, which is 85. In this case, the median is 85.
The median is particularly useful when dealing with skewed distributions or datasets that have outliers. If one student in the above example scored 50 instead of 85, the mean would be significantly affected, while the median would remain unaffected, still being 85.
The median offers a robust representation of central tendency because it considers the middle value, making it less sensitive to extreme values. This makes it a valuable tool in statistical analysis, helping researchers understand the overall distribution of data without being overly influenced by outliers.
Address
Developing Experts Limited
Exchange Street Buildings
35-37 Exchange Street
Norwich
NR2 1DP
UK
Phone
01603 273515
Email
hello@developingexperts.com
Copyright 2025 Developing Experts, All rights reserved.