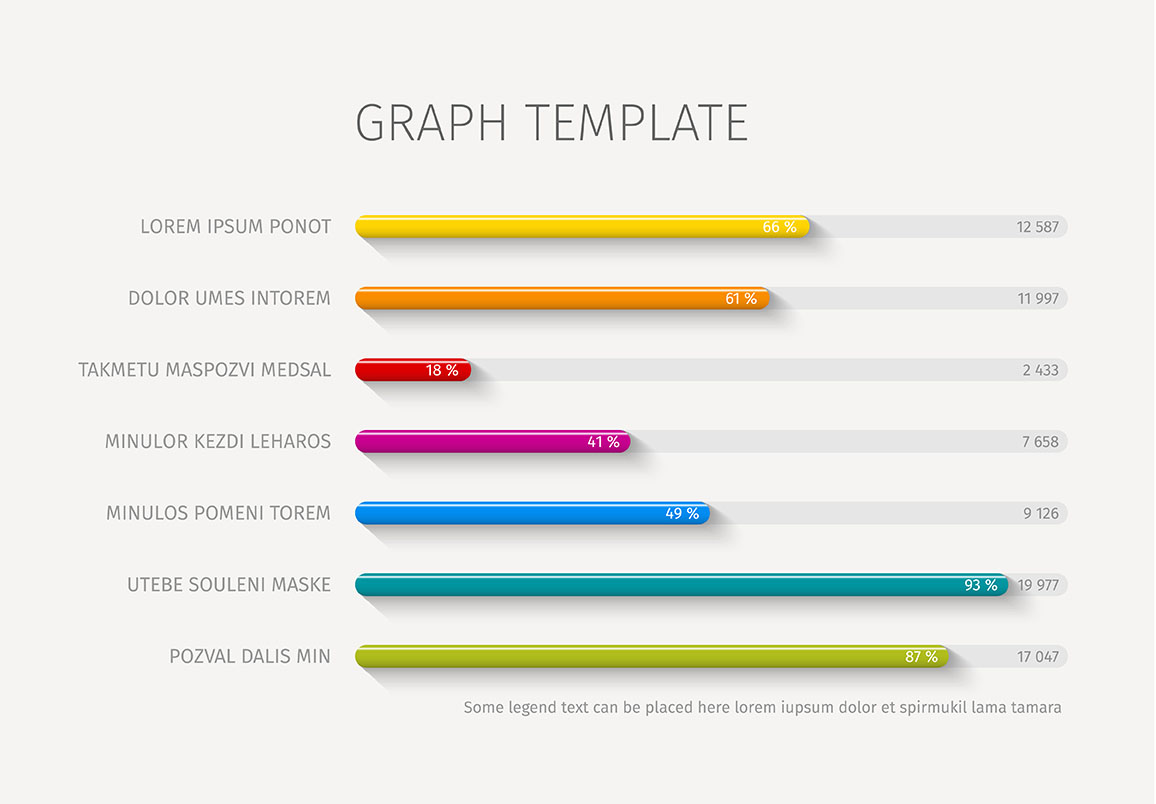

A bar chart is a graphical representation of data that uses bars to show the values of different categories. The bars are typically vertical, but they can also be horizontal. The height or length of each bar represents the value of the category it represents.
Bar charts are a versatile way to display data. They can be used to show the frequency of different categories, the distribution of data, or the comparison of different groups. Bar charts are often used in science to visualize data from experiments or surveys.
The bar chart showed the results of the survey.

Noun:
bar chart (a chart that uses bars to represent data).
Adjective:
bar chart (of or relating to a bar chart).
Verb:
bar chart (to create or display a bar chart).
The word "bar chart" is a compound word that comes from the words "bar" and "chart".
The word "bar" comes from the Old English word "bar", which means "a long, solid piece of wood or metal". The word "chart" comes from the Latin word "charta", which means "paper".
What data is useful to show using a bar chart?
Question:
Define a "bar chart" and describe its use in presenting data. Provide an example of a situation where a bar chart is a suitable representation for displaying information.
Answer:
A "bar chart" is a graphical representation of data using rectangular bars of equal width but varying lengths. The length of each bar corresponds to the quantity or frequency of a specific category or group within the data set.
Bar charts are commonly used to present and compare categorical data. They are especially useful for displaying discrete data with distinct categories. The x-axis of the chart represents the categories, and the y-axis represents the corresponding values or frequencies.
For example, a bar chart could be used to display the number of cars sold by different car manufacturers in a specific region during a given month. Each bar would represent a car manufacturer, and its height would be proportional to the number of cars sold by that manufacturer. This bar chart allows easy comparison of sales between manufacturers, making it a suitable representation for the data.
Address
Developing Experts Limited
Exchange Street Buildings
35-37 Exchange Street
Norwich
NR2 1DP
UK
Phone
01603 273515
Email
hello@developingexperts.com
Copyright 2025 Developing Experts, All rights reserved.